
Whilst sales methodologies have changed over the years some parts of sales haven’t changed at all. Dale Carniegie’s timeless classic How to win friends and influence people exemplifies this. First published in 1936, it is just as popular today and as relevant today as ever.
In a similar way the requirement to understand your key stakeholders in complex deals is equally vital. Such understanding can be easily achieved if you can visually see the contacts in one place. So mapping them in a graphical way is the natural way to go.
Is your name Napoleon? If the answer’s no then you really shouldn’t be using paper. Read on!!
If you are still wearing shoulder pads or styling out a curly mullet, then feel free to stick to the '80s solution.
If you are comfortable with data sitting outside your CRM and being disconnected then click the link above. But if you want a solution that sits inside your CRM, where your team works then read on.
Congratulations you are looking for a modern day solution!!
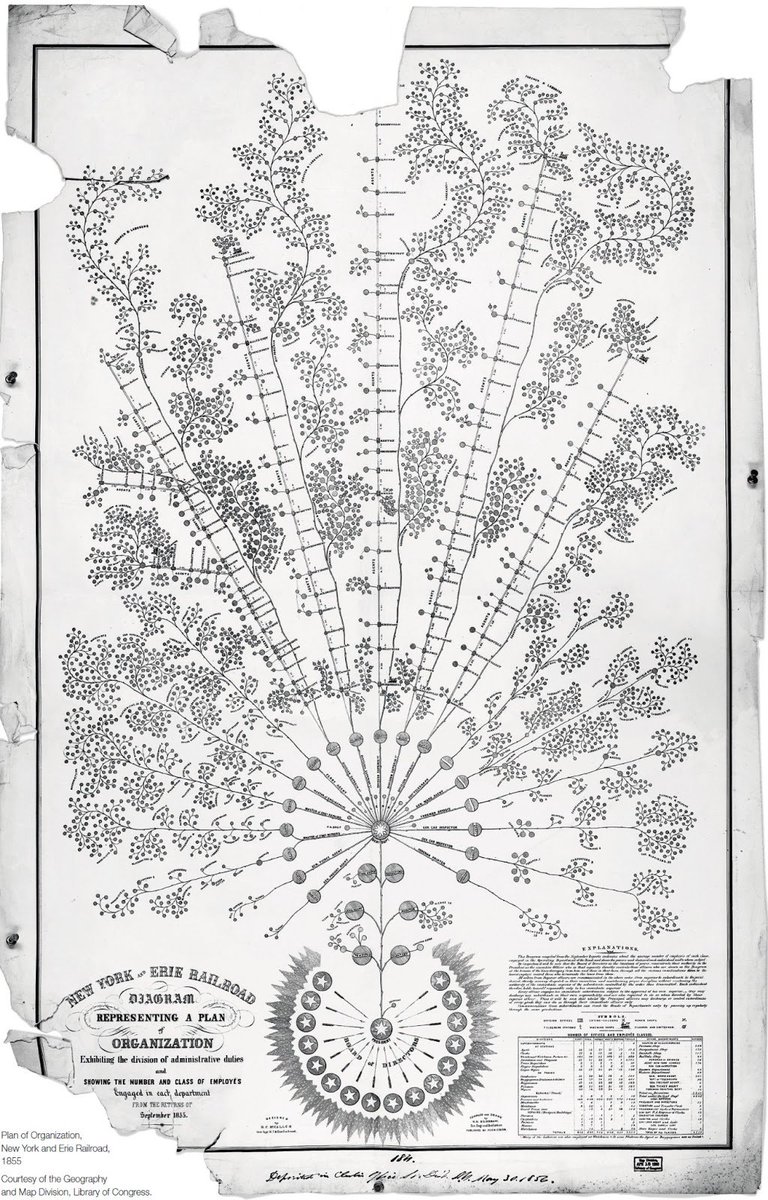
In 1885 the first “Modern day Organizational chart” was created and it’s a thing of beauty!!
Produced by Daniel McCallum, the general superintendent of the Erie Railroad. His problem was that many different workers and superintendents were responsible for different elements of the rail network and communicating potential problems quickly was vital to preventing accidents and delays. Further to this McCallum found it hard to keep track of who in his ever-expanding network of superintendents was responsible for what sections of track.
So he turned to a graphic in order that he could visually understand his key players within his business.
In 1917 we started to see the now more common layout, the modern Org Chart, put together on paper and distributed internally by The Tabulating Machine Co. who later became IBM.

We are speculating but probably sales teams between 1920’s and 1940’s started to map out their prospects using the IBM style Organization Chart format.
What we do know is that by 1978 Robert Miller and Stephen Heiman developed a methodology called “Conceptual Selling,” this teaches salespeople to thoroughly cover an account. Using a methodology which defines the sales process as “creating opportunities, managing opportunities and managing relationships.” So creating a deeper understanding of the key stakeholders and mapping them out.
This popular sales methodology, which is still run today by the Miller Heiman Group, came out before the invention of Excel or powerpoint so Org Charts on customers were produced on paper or on whiteboards.
If paper is still your bag, then please find a free template here, but read on if you don’t want to be stuck in the 80’s:
By the 1980’s Excel and Powerpoint became available and producing charts on customers became easier to assemble and share with colleagues. That said, you needed to create a template and sharing is not as easy as it is today.
In 2006 Google brought to market the GSuite, which included Google Sheets. It competes directly with Excel and when it comes to building Org Charts it offers additional functionality as you can grant your colleagues access to a live document.

Some sales teams still use Google docs, Word, Excel or Powerpoint for Org Charts. If that's you do please dip into the templates below. However, there is a better way which has developed over the last 5 years. A modern day solution, which is more efficient, easier to share and sits inside your CRM.
As sales teams started to adopt CRM’s in a big way, a shift began to happen. Sales reps were working from the CRM and explicitly told not to keep separate spreadsheets with company and contact information outside of the CRM. This is still an ongoing battle inside many companies today. However, we now have a younger more forward thinking group of salespeople who are familiar with CRM’s and happy to use them and see the benefits for themselves.
This has meant account planning and mapping has moved to where sales reps work, the CRM. Salesforce first made this possible in a meaningful way when they created an app marketplace where developers started to create Org Chart software. The software sat within the CRM and was easily accessible to the sales rep as well as contributing to the system of record.
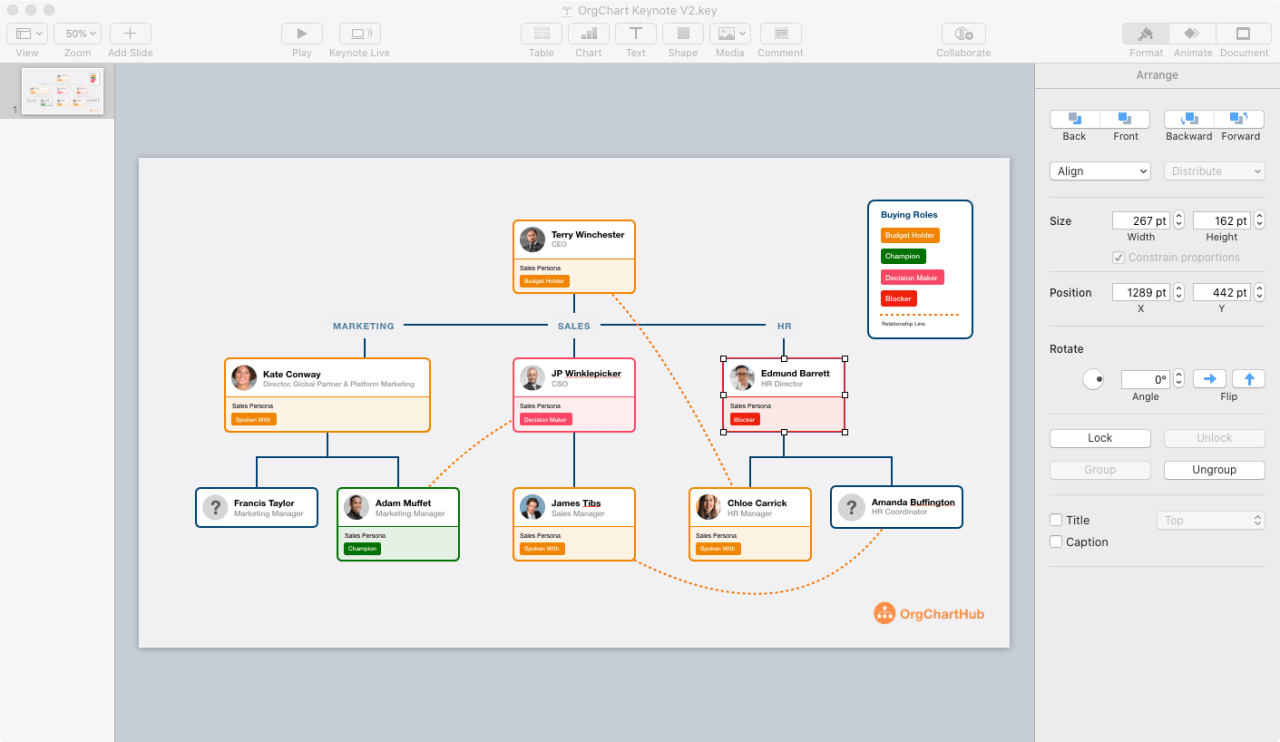
Now the Org Chart sits with the rest of the CRM data, rather than standing alone in a silo. It also makes the chart itself more powerful and insightful. In the example below communication levels across decision makers can now be surfaced.

Now sales teams are creating the inputs which help marketing teams to really start helping account based marketing campaigns. For instance using the buyer role properties to send targeted campaigns to budget holders or by sending enablement material to champions.

Now the charts are in the CRM, they cannot accidentally get lost or disappear when a sales rep leaves the business. The knowledge is passed on successfully to the next set of team members.
We think for sales teams who work on complex deals, building Org Charts and account maps is going to be an ongoing requirement. The average number of customer stakeholders involved in a B2B purchasing decision in 2016 was 6.8, according to Gartner. This number is likely to increase over time. When things get complex as Daniel McCallum showed us we need a visual to help us better understand and read the dynamics.
So perhaps his first org chart shows us the potential direction for the future. It looks so beautiful in design because it follows the shape of the rail lines. Daniel McCallum wanted to understand quickly where his team were positioned in relation to the rail line, so the visual is shaped to the original challenge.
When sales teams create OrgCharts, the main objective is to discover and map the key stakeholders. One element of this is to understand the reporting lines, but it's also just as important to understand the dynamic within the buying group. In particular the relationship lines, the order of influence and political dynamics etc.
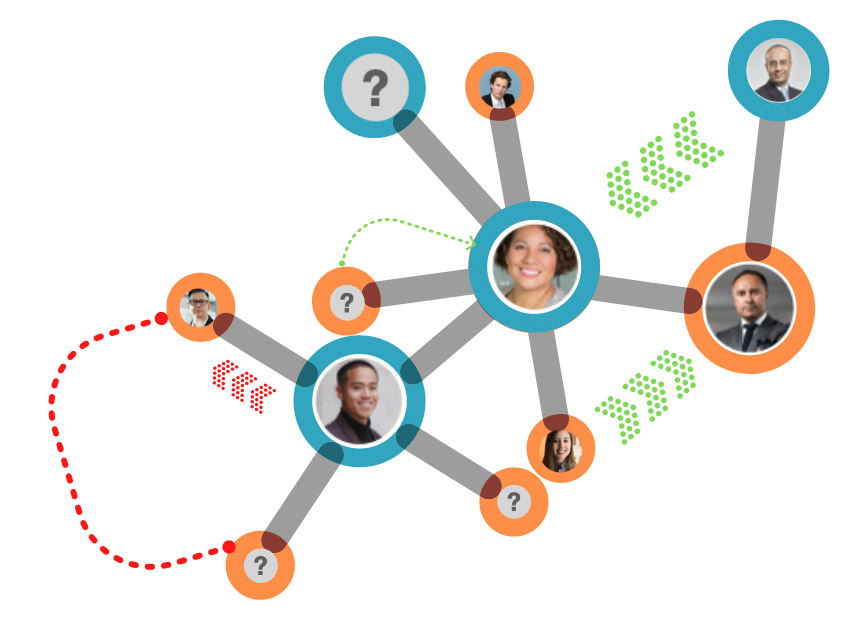
The reporting line view is important but perhaps there is a second view that could better represent the other dynamics at play. This could be better represented as a sphere or orbit of influence, when you are primarily trying to map deals, which is the original challenge. Not only do your buyers feature in this orbit but so could your team who are influencing and selling to the customer.

Our newsletter offers tips, tricks on how to gain extra insight on your account and from time to time exclusive access to our new BETA projects.